The main screen to check market data is the “CompSet Report”. Here the app displays the competitor rates and the market demand index. The screen has 3 sections:
1. The “Control” bar
The control bar allows users to select what data is displayed below:

The following controls are available:
- Timeframe – allows the selection of the time interval which is displayed below
- Attention: this control is not present when viewing the data in “Calendar View”
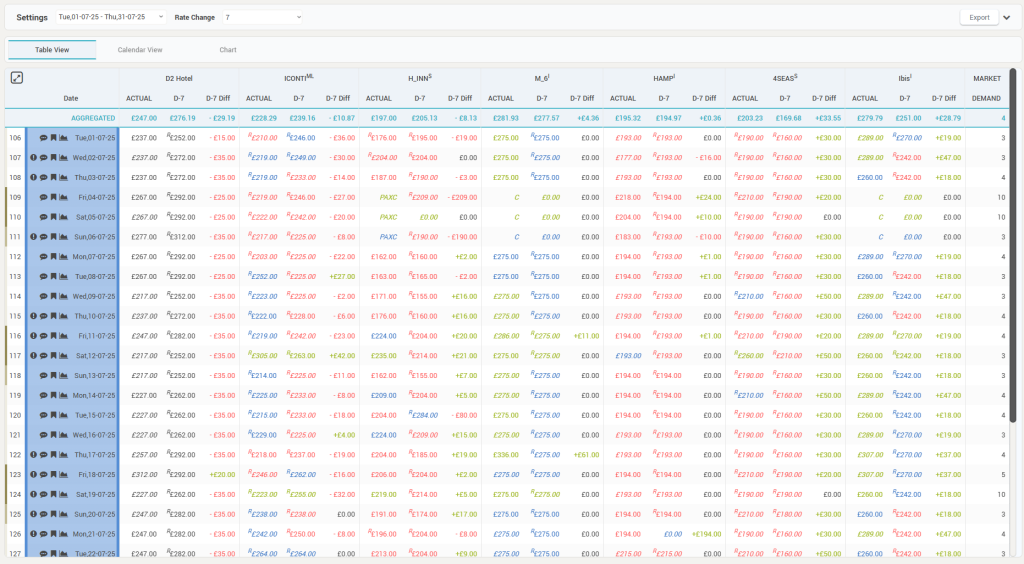
- Rate Change – allows selecting the number of days in the past to compare the current rates to. By default, the control has the value “Do not Show”. If any other value is selected, 2 additional columns are displayed in the “Table View” (one showing the rates as they were “x” days before and the other showing the difference between the current price and the price “x” days before).
- Attention: this control is present only when viewing the data in “Table View”:
- Source – selection of the channel.
- PAX – selection of the room occupancy for which rates are to be displayed.
- Breakfast – possible options:
- Any Breakfast – no filtering based on breakfast.
- Breakfast Included – only the rates with breakfast are considered. If any of the properties does not have rates with breakfast included, nothing is displayed for those properties.
- Breakfast Excluded – only the rates with breakfast are considered. If any of the properties does not have rates with breakfast included, nothing is displayed for those properties.
- LoS – selection of the length of stay.
- Rate Value – possible options:
- Lowest rates – the lowest rate from each property (regardless of policies) is displayed
- Lowest unrestricted rates – the lowest unrestricted rate from each property is displayed. “Unrestricted” means there are no special conditions for the offer (e.g. “free cancellation”).
- Lowest restricted rates – the lowest restricted rate from each property is displayed. “Restricted” means there are special conditions for the offer (e.g. “non cancelable”, “advance purchase”, “non-refundable”).
- Highest rates – the highest rate from each property (regardless of policies) is displayed
- Highest unrestricted rates – the highest unrestricted rate from each property is displayed. “Unrestricted” means there are no special conditions for the offer (e.g. “free cancelation”).
- Highest restricted rates – the highest restricted rate from each property is displayed. “Restricted” means there are special conditions for the offer (e.g. “non cancelable”, “advance purchase”, “non-refundable”).
- Room Value – selection of the room type for which rates are displayed.
- Attention: This control works in conjunction with the “Compset Room Mapping” screen.
2. The “Tab” selection
Each “Tab” allows viewing the data in a certain way. It is possible to change the order of the “tab” options by clicking the arrows that appear when hovering the mouse over any of the tabs:

There are 3 viewving options, presented individually below.
3. The “Data” section
This section displays the compset rate and market demand data (as selected in the control bar) based on the selected “tab”:

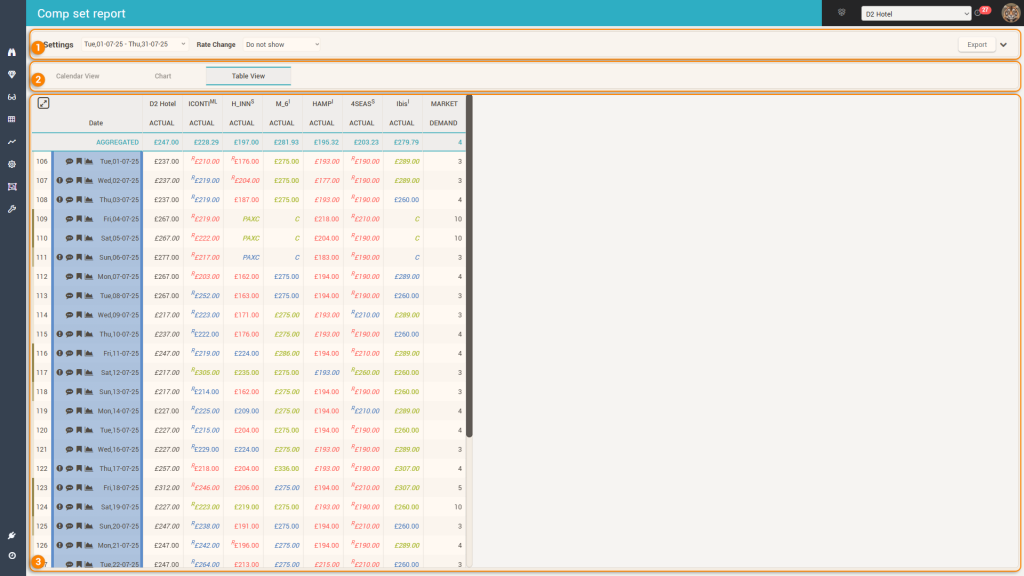
a. Table View
This view shows the data in an interactive data grid, similar in functionality with other grids in the app (Timeline, Pickup Report, etc):
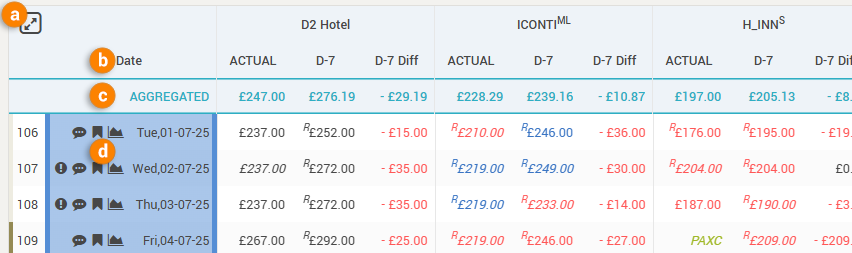
a. Maximize / Minimize the grid display with the help of this “toggle” icon. When maximized, the menu and top bars of the app are hidden, along with the tabs section of the screen.
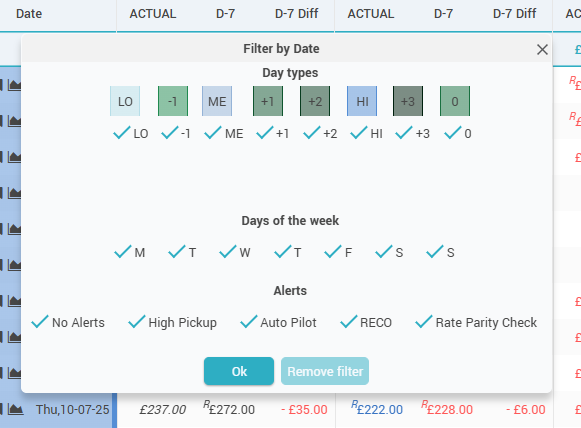
b. Column name – clicking the column name displays a filtering option:
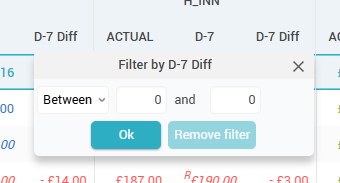
The “Date” column in the grid is a special column and it has a special filter:
c. The “AGGREGATED” row – this special row shows the average for each column, for the selected period.
d. The “Header” column
The grid starts on the left-hand side with the “Header” column. This column shows the arrival date and the following additional fetures.
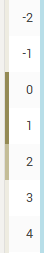
- The “Days Out” information – how many days between the respective date and the current date (so “0” when the row displays the data for “today”). This information comes also with a color-coded border to the left, visually highlighting the weekend days from the work days:
- The background for each row is color-coded to represent the season (or event category) color of the respective date:
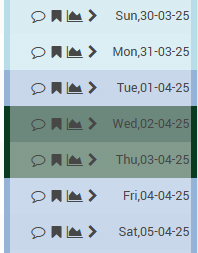
- The “Alerts” icon (
 ), showing any alerts that were triggered for the respective date:
- The “Comments” icon (
 ), showing if there are any comments written for the specific date.
- When clicking it, users can quickly add a comment directly from the grid:
- The “Events” icon (
 ), showing on mouseover the season and the list of events happening on the respective date.
- When clicked, it allows quick access to manage the events for the respective date:
- The “Day Inspector” icon (
 ), showing when clicked the day inspector (“Day Inspector“).
Tip 1: hovering the mouse over an arrival date label will show the “Mini Day Inspector“.
Tip 2: Clicking on any value in the grid makes all the values from that row be displayed in “bold”.
The grid displays the data for the subscriber hotel and all the other properties in the CompSet. The order in which the properties appear as column groups is defined in the “Settings > Competitors” screen.
For each property, the following data is displayed:
- ACTUAL – the most current rates shopped
- D-x – the rates as they were x days before – “x” controlled by the “Rate Change” parameter in the control bar
- D-x Diff – the difference between the most current rate and the rate from “x” days before.
The rates are displayed color-coded and also with some visual “indicators”. Below are some explanations:
- The values are colored based on their “relation” vs the subscriber’s own shopped rates:
- Green means the Competitor’s rate is higher than the defined comfort zone (“Settings->Competitors“) vs the hotel’s own rate
- Red means the value is lower than the comfort zone
- Blue means the value is within the comfort zone
- An “R” to the left of the price amount indicates the value is for a restricted rate.
- If the values are displayed in “italics”, it means the rte displayed is not mapped to the “reference offer” (“CompSet Room Type Mappings“) of the subscriber.
- If there is an “exclamation” mark next to the rate, it means that the shopper did not find a rate available when scraping for LoS = 1, but found for LoS 2 or 3, etc and the value displayed is calculated by dividing the shopped amount to the LoS (thus arriving to a “per day” estimated price point).
- Rates from the scraper’s “last scheduled shop” are displayed in full color, while rates within the freshness period are displayed in a “faded” mode to visually indicate they are “fresh enough” for the RECO algorithm to use them but they are not as fresh as they should be (meaning not from the “last scheduled shop”). The freshness is defined in the “Settings > RECO” screen (the “Data Freshness” section).
- Special “codes” are displayed in the situation when no price was found:
- “PAXC” – when the scraper did not find a price for the selected PAX, but it did find rates for at least one other PAX
- “C” – when the scraper did not find any price for any PAX and any other LoS. The scraper automatically tries longer lengths of stay (+1 and +2 nights) when nothing is found for the LoS searched.
- “-” or an empty cell is displayed in case of scraper errors
MARKET – this column shows the DEMAND index as calculated by the system based on number of available hotels in the destination and the destination’s filters.
- Attention: the destination filters are controlled during the onboarding process (“Implementation form“) and can only be changed afterwards by the technical support team.
b. Calendar View
This view shows data in a calendar:
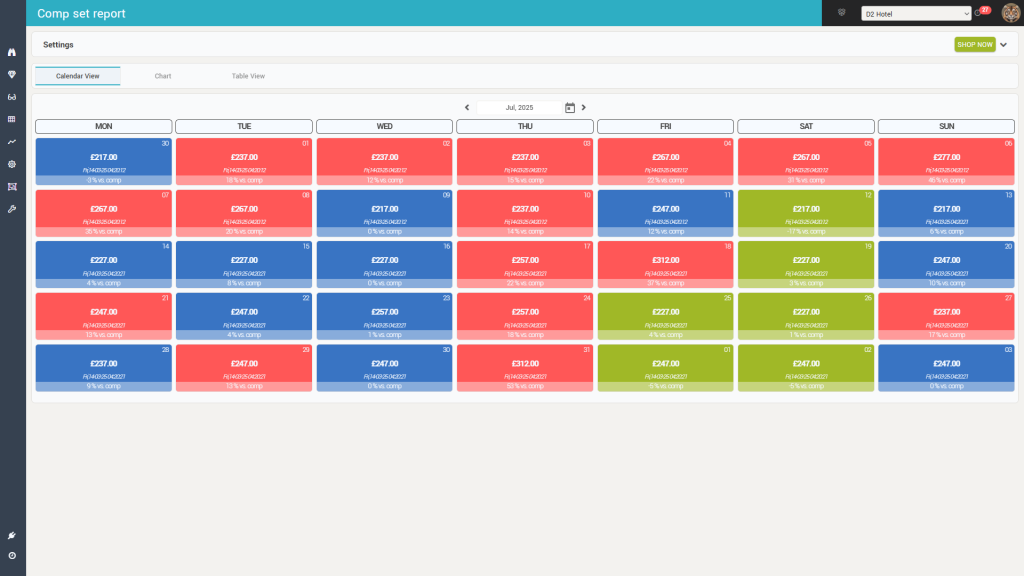
The calendar shows one month, selected above the calendar display (![]() ).
).
Each cell in the calendar shows the following information:
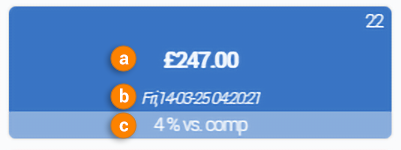
- a. The rate of the subscriber (as selected in the “control” bar)
- b. The time when the rate was shopped
- The comparison versus the CompSet median rate.
- Based on this value and the “comfort zone” (as defined in the “Settings > Competitors” screen), the background color of the cell changes from blue (difference is within the comfort zone) to red (CompSet median is lower) or green (CompSet median is higher).
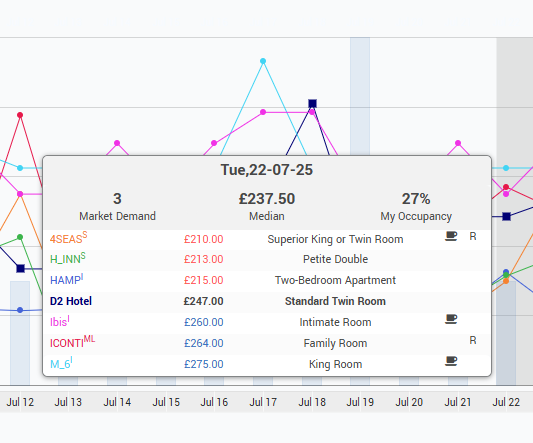
Hovering the mouse over a cell shows a popup with detailed pricing per property:
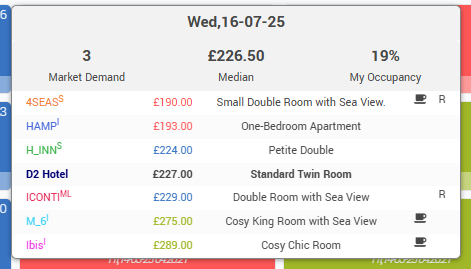
- The “header” shows the market demand index, the CompSet Median rate and the occupancy of the subscriber.
- The list shows the prices for the subscriber hotel and then the competitors (in their default order):
- the short-code of the property
- the color-coded rate
- the “name” of the room type
- an indicator if the rate is including breakfast or not (
 )
) - an indicator showing if the rate is restrictive (“non-cancelable”, “advance purchase”, etc.) or not (“free cancellation”).
- If the “Override default Competitors Order” parameter in the “Settings > Basic” screen is “On”, the list is ordered by price ascending (like in the above screenshot)
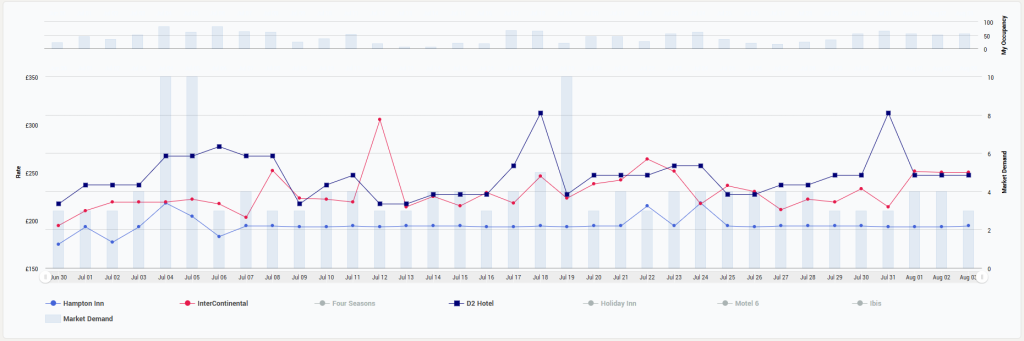
c. The Chart view
This view displayed the selected rates in a combo chart:
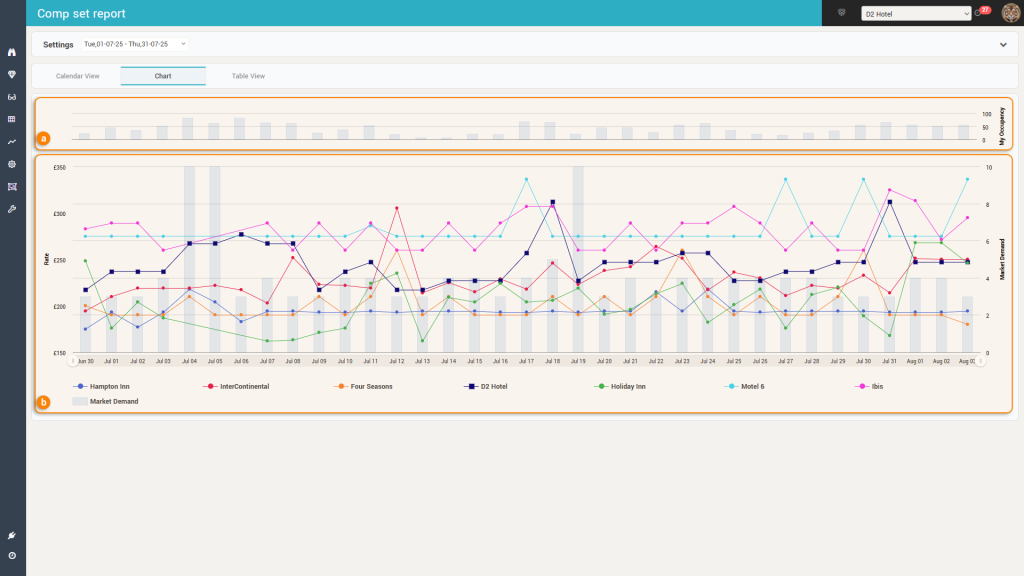
The chart has two sections:
- a. a small top section showing the subscriber’s occupancy
- b. the main section showing the rates and the market demand
Hovering the mouse over the chart will display the same popup with detailed information as described above (in the calendar view):
The chart’s legend section allows to focus on one aspect of the chart (by hovering the mouse over it’s label):
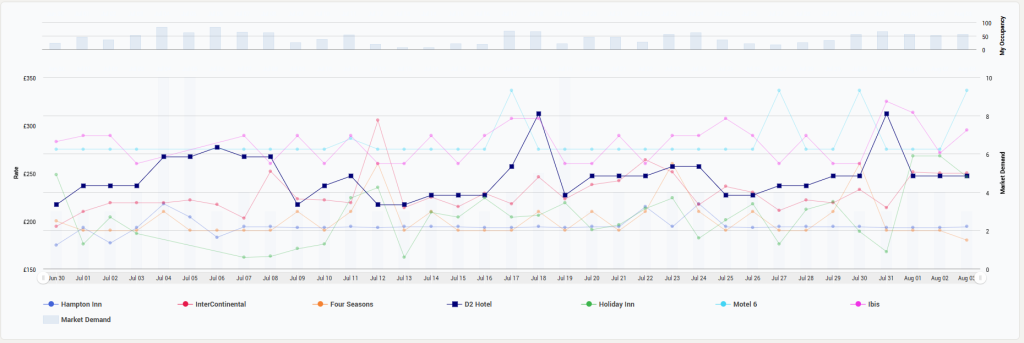
Also, it allows to hide completely certain data series by clicking the name in the legend: