The “Hotel Rates” screen allows you to define your high-level pricing strategy for each season / event category. The values here represent the “boundaries” that the price optimization algorithm uses to produce the recommended rate. Please read the “Optimization Algorithm” page for more details on the optimization algorithm.
The screen looks like this:
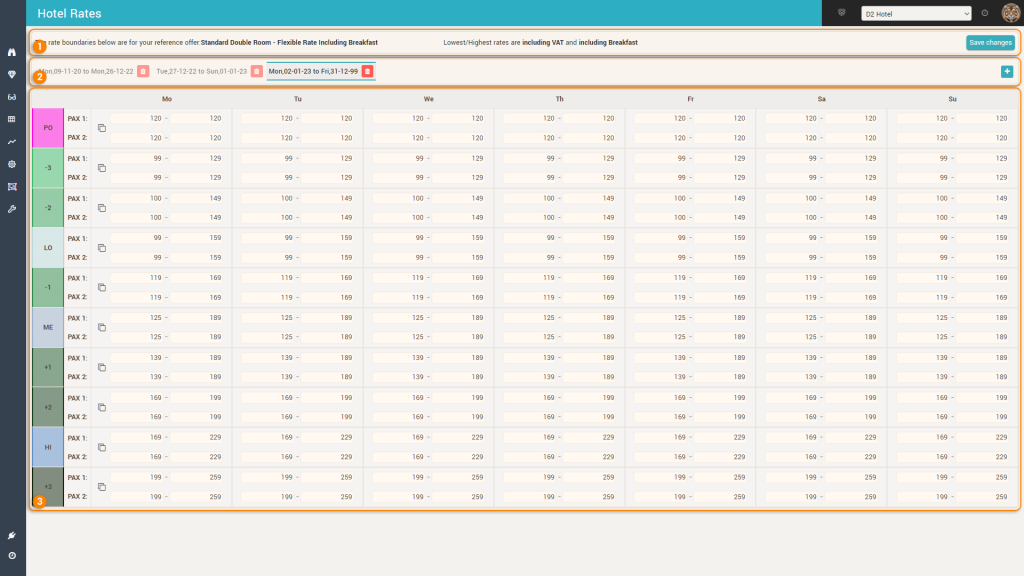
1. The Control Bar
The control bar displays the reference offer (reference room type + reference rate plan) which was defined in the “Room Types and Rate Plans” screen. The optimization algorithm, when calculating the optimal rate for the reference offer, will use the values from this screen as “boundaries”.
The bar also shows if the rates are to be considered as “including VAT” or “excluding VAT”. You can control this from the Settings screen, the “Basic” tab (the “Price Type” parameter).
Also, the fact that the rates are to be considered as including or excluding breakfast is displayed. This is based on the selection of “Incl. Breakfast” for the reference rate plan in the “Room Types and Rate Plans” screen.
The “Save Changes” button will save the changes made to the rate boundaries to the database.
2. The “Periods” Bar
The app gives you full flexibility in defining the boundaries. As such, they can be defined differently for different periods and also differently by day-of-week within the same period.
By default, the app will create one long period, starting with the date when the hotel is onboarded and ending in 2099.
Clicking the “+” icon on the right-hand side will allow you to add a new period:
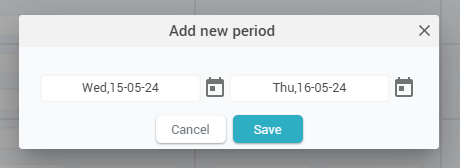
Remember: When a new period is added, all existing periods that might overlap with the new period are automatically modified by the app so that a continuous time-flow is kept from period to period. In other words, the app will adjust the start or end dates of the overlapping periods to ensure there are no gaps between periods and that periods do not overlap.
3. The Grid
Each row of the grid will allow the definition of boundaries for one season or event category:

a. The “header” column: shows the code and color of the season / event category. You can click and drag the header column to reorder the rows in the grid.
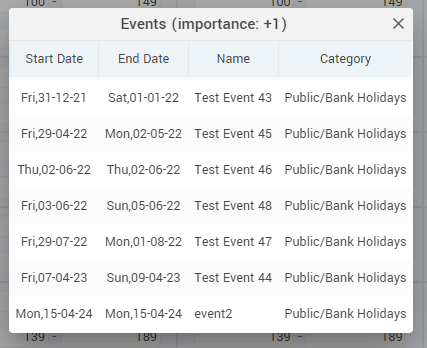
When right-clicking on the header cell of an event category row, a popup shows all the events in the respective category:
b. Copy Icon: clicking this icon will copy the values defined for Monday to all other days-of-week.
c. The lowest/highest boundaries: these inputs represent the boundaries defined for each season/event category and day-of-week, per period. Based on the “Pricing” parameter in the Settings – Basic section, you are allowed (or not) to enter values with decimals.
Best practice:
- Order the rows in the grid based on your general pricing structure, either with the highest average priced season/event category first and the lowest last, or vice-versa. This will help you visualize better the differences in overall pricing structure between seasons and event categories.
- Allow boundaries to overlap between seasons/event categories.
- Good Example:
- Low season: between 50 and 90
- Mid season: between 65 and 110
- High season: between 75 and 140
- Bad example:
- Low season: between 50 and 70
- Mid season: between 70 and 100
- High season: between 100 and 140
- Good Example:
- Imagine the boundaries like this:
- The low boundary would represent the lowest price you would sell your reference room in that season. In other words, is the price point you start with for a given day when there is nothing on the books.
- The high boundary would represent the highest price you believe your customers would pay when you have only a few rooms left available on a given day of the respective season / event category.
Remember: If the boundaries are not defined for a particular season / event category (you see values of 0 in the grid) the optimization algorithm will not calculate a RECO price for any day within the respective season or events in the respective event category.