The Guest Rating can be seen in the following screens:
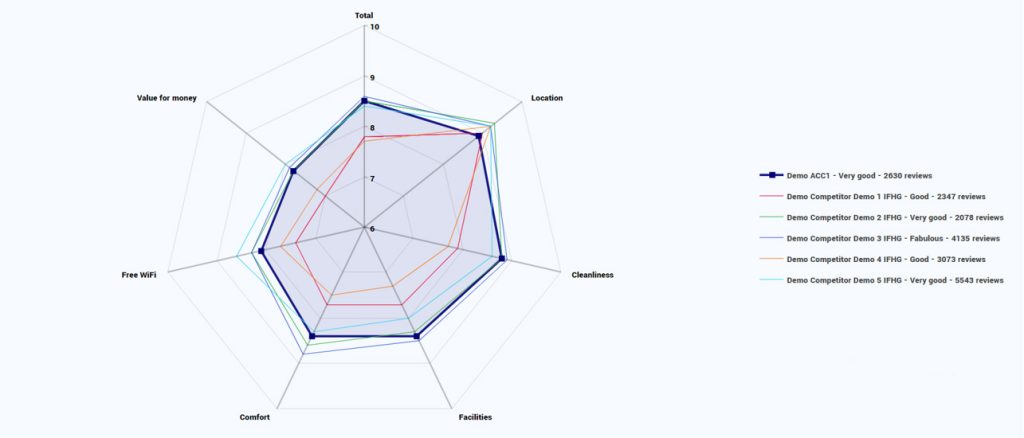
Dashboard – Guest Rating Graph
Guest Rating Section displays your booking.com reviews vs. your compset, for the following categories:
- Location
- Comfort
- Staff
- Cleanliness
- Value for money
- Facilities
- Free WiFi
It also displays the total number of reviews and the average guest rating for all categories.
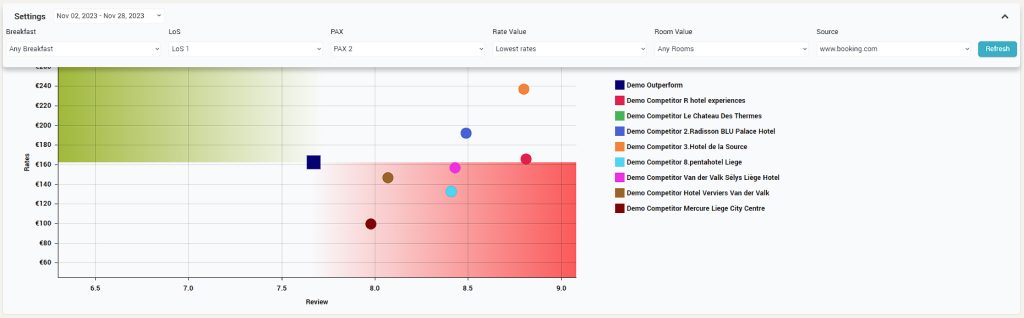
Channel Value Index
This screen depicts the hotel’s review score and the rate for the selected room value and rate value options, for a particular date or period. The filters placed on top of the graph enables the user to customize the report.
The value analysis consists of two main matrixes: The hotel’s review score and the lowest published rate.
Subscriber hotel is always plotted in the center, thus dividing the chart in four quadrants, representing:
- Upper left quadrant: Competitors display relatively high rates in relation to their review score.
- Upper right quadrant: Competitors offer a lot of value to guests and have reason to charge a high rate.
- Lower right quadrant: Competitors are likely to underprice themselves – they offer greater value at comparable cheaper rates.
- Lower left quadrant: Competitors offer a less popular product at a lower rate.