The competitor’s rates can be seen in the following screens:
- Dashboard > Daily View
- Day Inspector
- Timeline
- Comp set Report
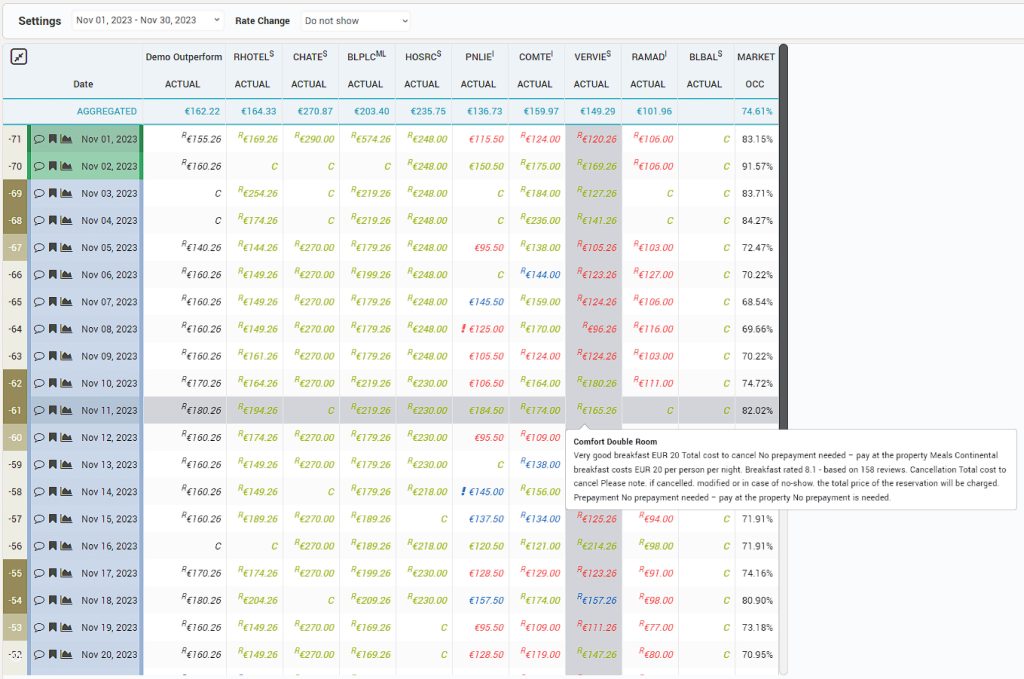
Dashboard – Daily View
In Dashboard > Daily View tab, the CompSet section has an option to Show / Hide the CompSet list (hidden by default). The Median of the CompSet is also available.
The letter “C” is used instead of the rate when the rate is not available. Rates marked with “R” are Restricted Rates.
Color coding:
- Green: the competitor’s rate is bigger than the subscriber hotel’s rate
- Blue: the competitor’s rate is similar to the subscriber hotel’s rate
- Red: the competitor’s rate is smaller than the subscriber hotel’s rate
Details about the rate are displayed at mouseover:
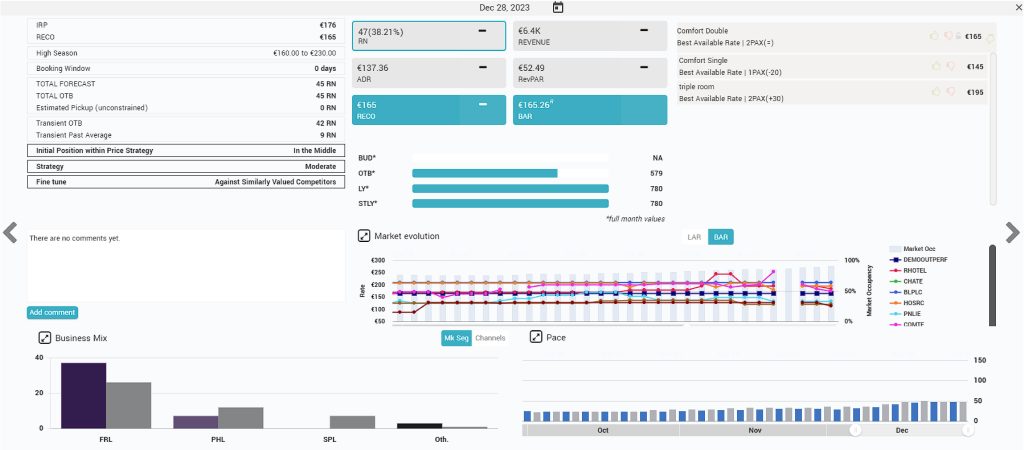
Day Inspector
CompSet Rate and Market Occ evolution are displayed in a graph, with option to display BAR or LAR rates. Rates are displayed on the right of the graph at mouseover:
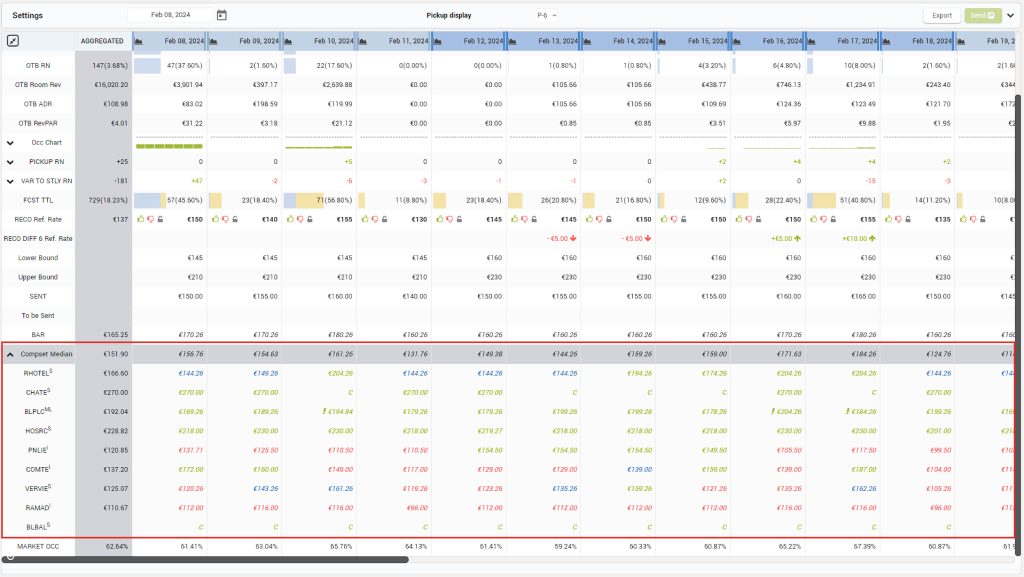
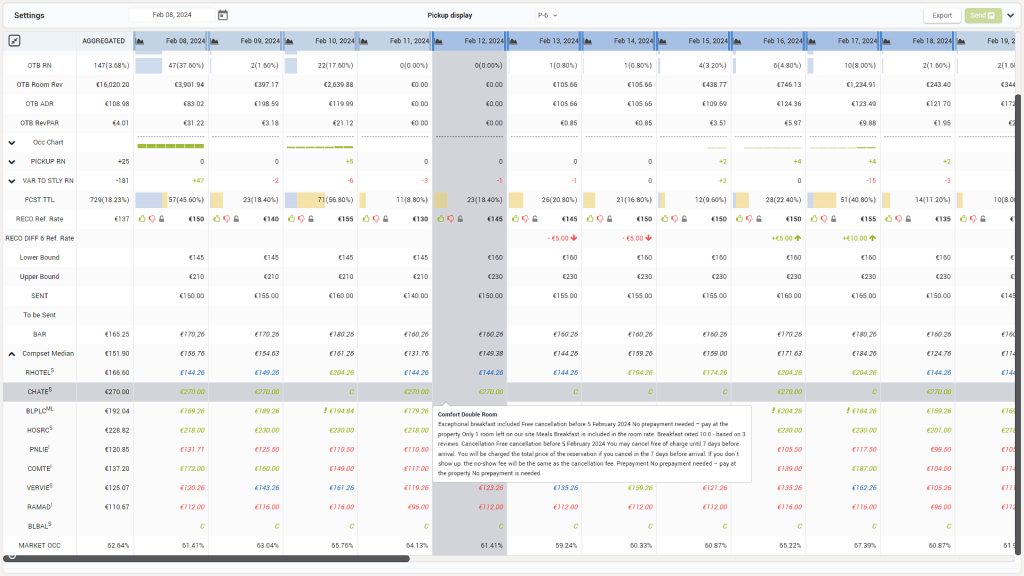
Timeline
In Timeline screen, the CompSet rates are available for daily, weekly and monthly granularity. For Weekly and Monthly granularity the average rate is calculated and displayed. Details about the rate shopped are shown at mouseover:
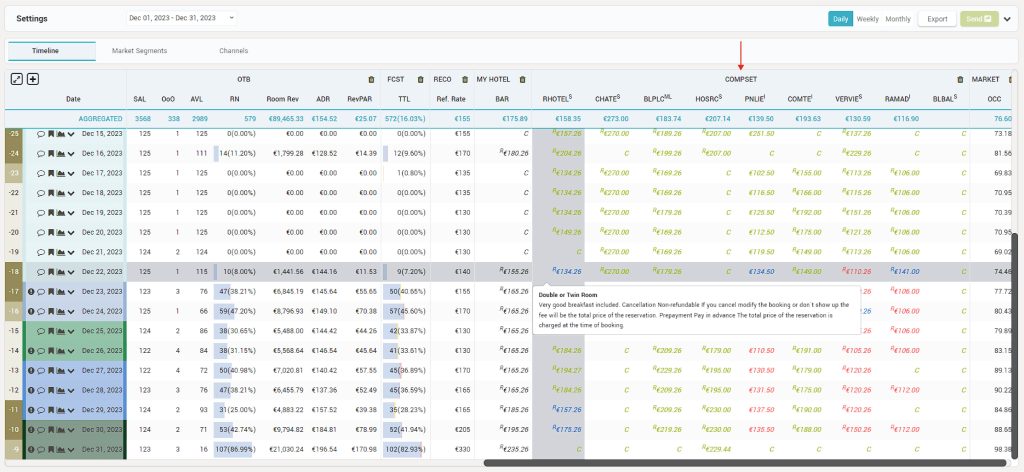
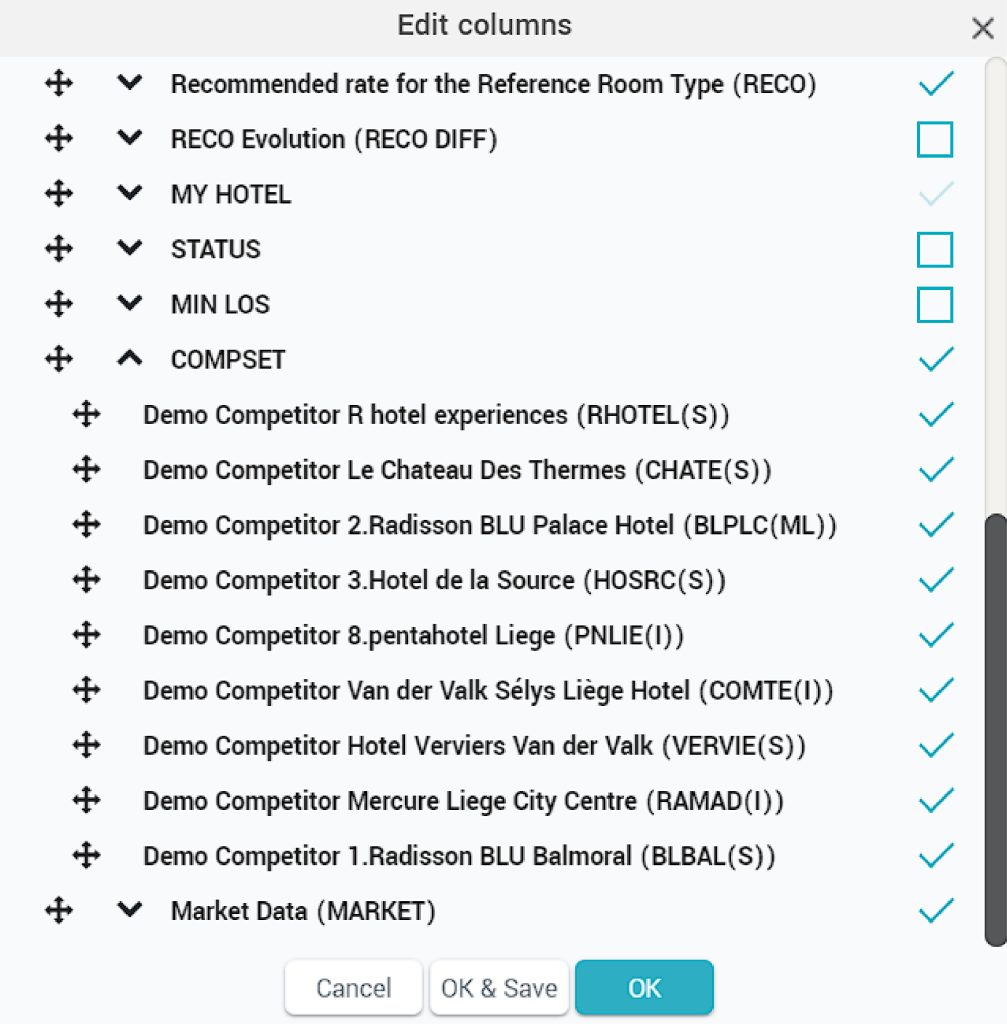
The CompSet section is added from the Edit column button and the user can even choose to display only particular competitors:
CompSet Report
Report which allows the user to see all the shopped rates, not just the BAR.
There are three tabs available for showing shopped data, in different views: calendar, chart or table.
Calendar View
- Filters which allow the user to generate a custom report with the desired parameters. Room value (restricted or not restricted rooms and rates per different room type); Rate value (lowest / highest restricted or not restricted rates); Length of Stay (it will display the LoSs equal or higher than the value you have chosen); Source – allows the generating of shop report per Source (only for hotels that have OTA Insight account); Pax (1 or 2 PAX); Breakfast – Including / Excluding / Any Breakfast;
- SHOP NOW button
- Generate report button for applying selected filters
- Move to Previous / Next month arrows
- More details are shown at mouse over for each day:
Rate of Subscriber and each competitor
The room type
LOS shopped
Restricted Rates marked with R
Rates including breakfast are marked as well
Median of the CompSet
Market occupancy (%) - The colors mark the difference between the hotel’s rates and competitors’ rates and can be adjusted from the slider, in order to define the comfort zone. For example, if your price is 15% lower than the median of the competitor’s prices, the day will be marked with green. If your price is 5% or more higher than the median of the competitor’s price, the date will be marked with red.
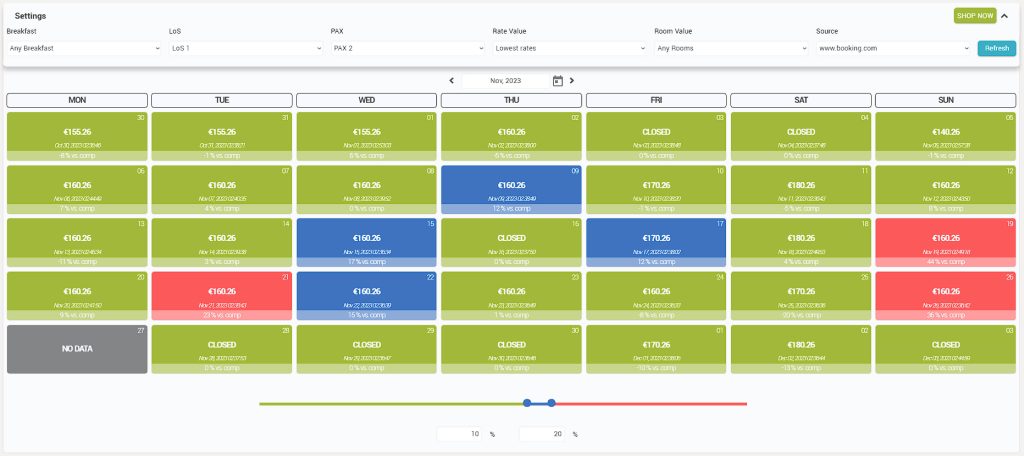
Chart View
- Filters (see details in calendar view section).
- “Refresh” button used to generate the report with the defined filters.
- Details displayed at mouse-over (same as in calendar view).
- Graph lines representing the hotels rates.
- Bars representing market demand.
- Slider used to adjust the displayed period.
- The user can hide lines of any hotel.
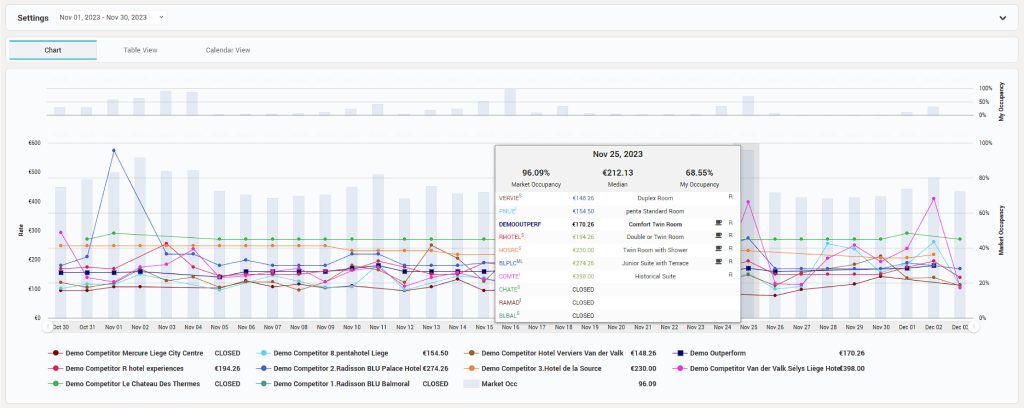
Table View
- Filters (see details in calendar view section).
- “Refresh” button used to generate the report with the defined filters.
- Check the rate changes for the last 1 to 7, 14 or 30 days (including the competitor’s rate changes).
- Current rate.
- Yesterday’s rate.
- Details displayed at mouse-over.