KPIs values can be checked on a monthly basis, within the following screens:
Dashboard – Monthly View Tab
Displays data per month, starting with current month, up to one year in the future.
Clicking on a specific month, the Daily View is loaded, with daily values for that particular month
Apart from aggregated OTB data, it includes:
- RN, Revenue & ADR Pickup for 1, 2, 3, 4, 5, 6, 7, 14 and 30;
- Distance to Budget / Forecast for RN, Revenue and ADR (if the Monthly Budget is set up);
- Variance to Same Time Last Year / LY for RN, Revenue, ADR and RevPAR.
In case there is no HIST data available, the LY / STLY section will display “NA”.
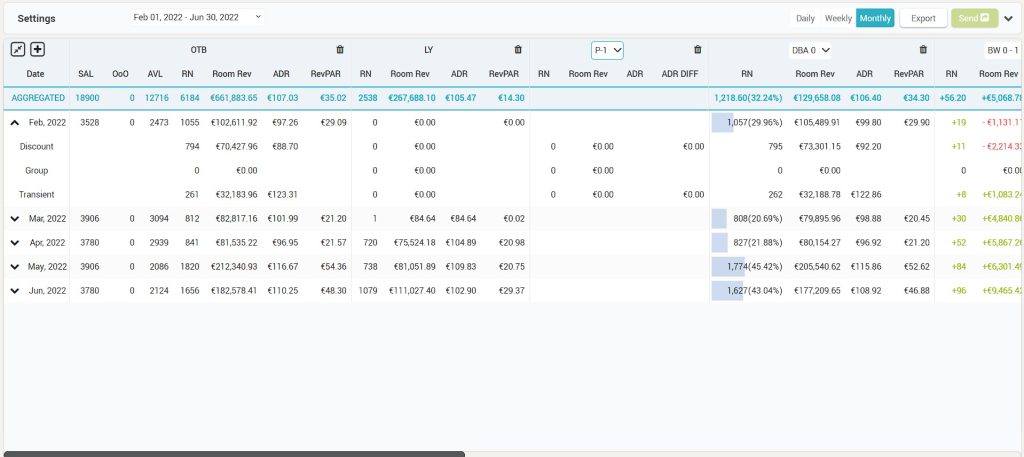
Timeline – Monthly Granularity
- Go to Timeline menu
- Open the filter section and choose “Monthly” granularity.
- Click on “Edit Columns” to customize the report by adding or removing columns.
There are several KPIs that can be seen in monthly granularity:
- Room Nights
- Revenue
- ADR
- RevPAR
The above KPIs are in the following categories: On the Books values, Actual Values for Last Year, Same Time values for Last Year, Actual values from 2 years ago, Same Time values for 2 years ago, Variance to Last Year, Variance to STLY, Variance to 2 years ago, Variance to same time 2 years ago.
- Pickup for RN, Room Revenue, ADR for picked up business, ADR difference (Difference in ADR before and after pickup).
Other information is available in addition to the above KPIs: Live Forecast calculated by the system, MinLos and Open / Close Recommendations, Market Occupancy and Compset Rates, Recommended Rate for the Reference Room Type, Last price sent, Lowest available rate found online.
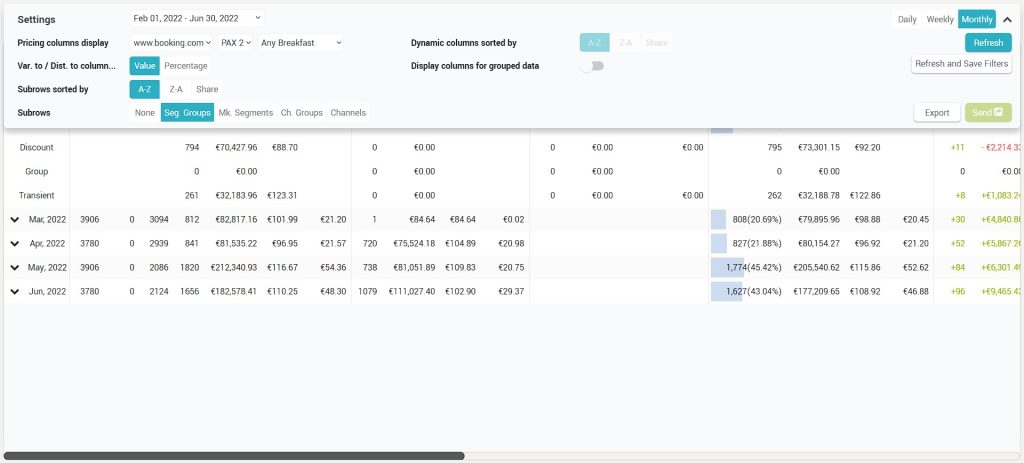
Timeline screen details for image below are as follows:
- To add or remove columns, the edit button is used (+). When clicking the (+) button, the “Edit Columns” popup opens.
- The user can hide columns (similar to the pickup report).
- The order of the columns can be changed using the “Edit Columns” feature (drag and drop).
- The columns have “short” and “long” names. The timeline columns display the short name and on mouseover the long name. The Edit popup display both short and long names, in this format: “Long name (short name)“.
- The entire upper horizontal space next to “Timeline Settings” is clickable to open and close the filter menu.
- The user can add data displayed in Timeline as sub rows. The available data is per Segment Group / Market Segments / Channels / Room Types and will be added to each row. Data displayed for these rows can also be sorted: A-Z, Z-A or per Share.
- “Dynamic columns sorted by” filter is available only for Market Segments / Channels / Room Types Tabs. “Room Type columns Share by” is available only for Room Types tab.