The variance to Last Year (LY) values and/or Same Time Last Year (STLY) values can be seen in the following screens:
Dashboard
Skyscraper
The Skyscraper is a chart that displays the occupancy. By default, the dates shown on the skyscraper are 31st days in the future, starting with the current date.
Hovering over the bars, details about the selected day and the similar day last year are shown: Occ %, Occ RNs, Occ % LY, Occ RN LY, Season type and Last year corresponding date:
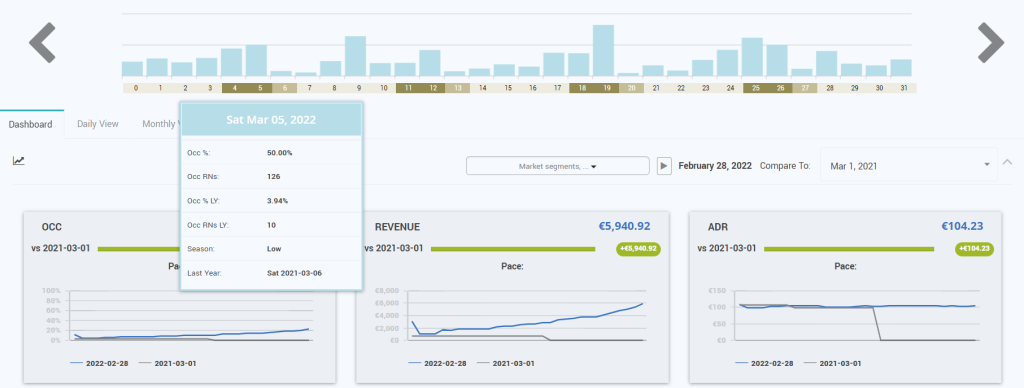
In case of event days, more information is displayed: event name, duration of the event and event category.
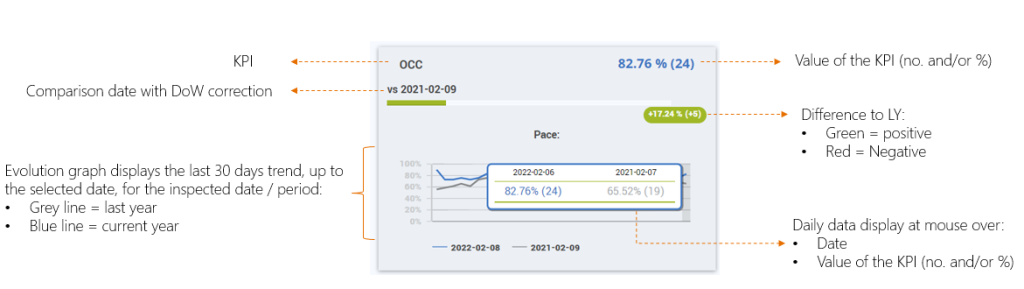
Dashboard Statistics Cards
By default, the statistics card load evolution data for the current date in comparison with the similar date last year (with DoW correction).
On each KPI card, the comparison date with DoW correction is displayed on the left corner of the card. The difference is displayed on the right and the actual values can be seen at mouse over on the graph.
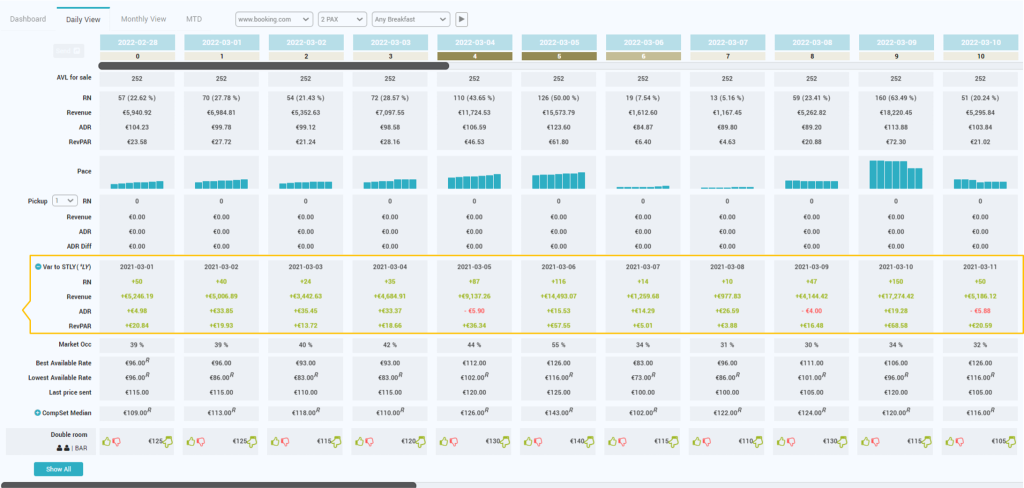
Dashboard – Daily View Tab
Displays STLY or LY values for the following KPIs: RN, Revenue, ADR, RevPAR.
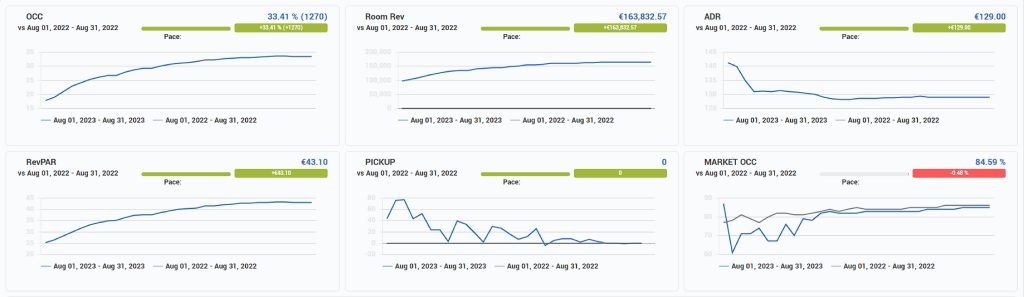
Dashboard – Monthly View Tab
Displays STLY or LY values for the following KPIs: RN, Revenue, ADR, RevPAR as monthly values.
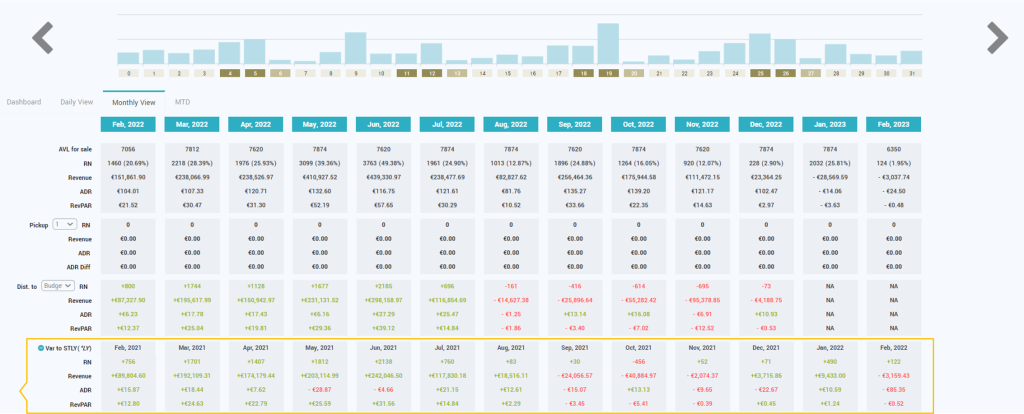
In both last cases, STLY values are loaded by default. If the hotel does not have the data for STLY available inside the system, LY final values will be displayed instead (if available).