The user can compare current year’s evolution of the KPIs with last year’s evolution in the following screens:
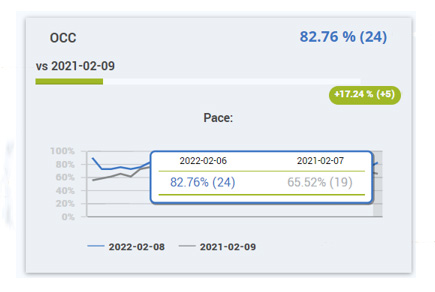
Dashboard – Statistics Cards
One can compare the evolution of current year’s values with last year’s values for the following KPIs:
- Occupancy
- Revenue
- ADR
- RevPAR
- Pickup
- Market Occupancy
All cards are displaying a 30 days’ evolution for the selected date, in comparison with last year performance, with DoW correction, from the same perspective.
The date or period compared can be customized from the general date picker.
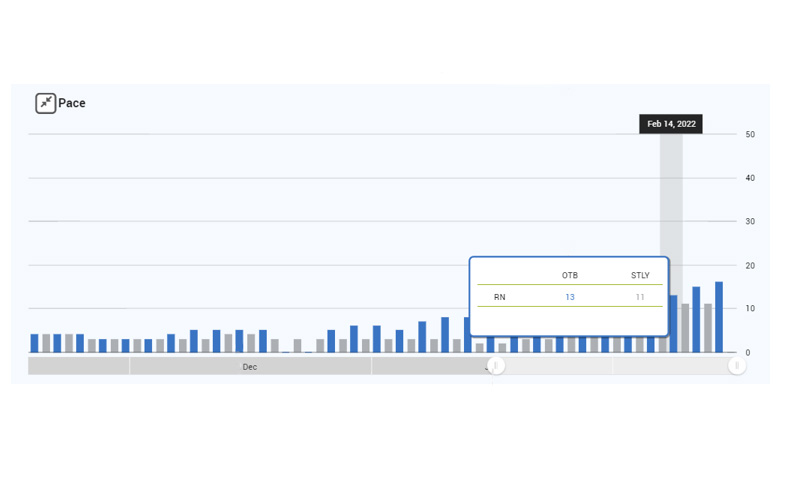
Day Inspector
In this screen, the user can compare the Pace for current year with last year.
The graph depicts the evolution of RN for the inspected date, over the last 30 days, in comparison with last year. The 30 days evolution is loaded by default, but the period can be adjusted by using the slider.