Report which allows the user to see all the shopped rates, not just the BAR / LAR.
There are three tabs available for showing shopped data in calendar view, as chart or as table.
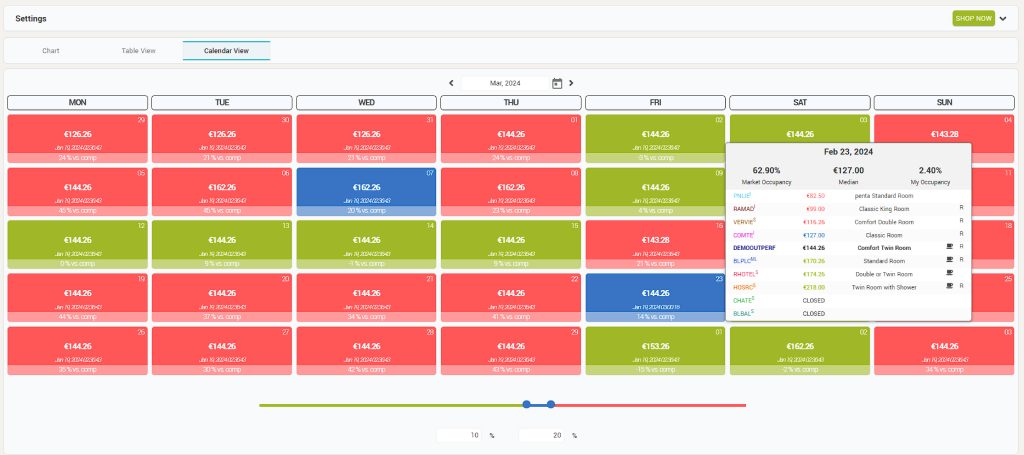
1. Settings bar with the “SHOP NOW” pinned to it. The “Shop Now” button allows the user to generate a live shop. Once the Settings bar is clicked, filters which allow the user to generate a custom report, with the desired parameters, are revealed. “Refresh page” generates the report with the customized filters.
2. The three available tabs which display shopped data in different views: Calendar, Chart, Table. Tabs order can be changed using the arrows on each tab.
3. Month picker.
4. Details displayed at mouse over on a particular day.
5. Comfort zone slider. The colors mark the difference between the hotel’s rates and competitors’ rates and can be adjusted from the slider, in order to define the comfort zone. i.e.: If your price is 15% lower than the median of the competitor’s prices, the day will be marked with green. If your price is 18% higher than the median of the competitor’s price, the date will be marked with red. The in-between values are marked with Blue.
Chart View
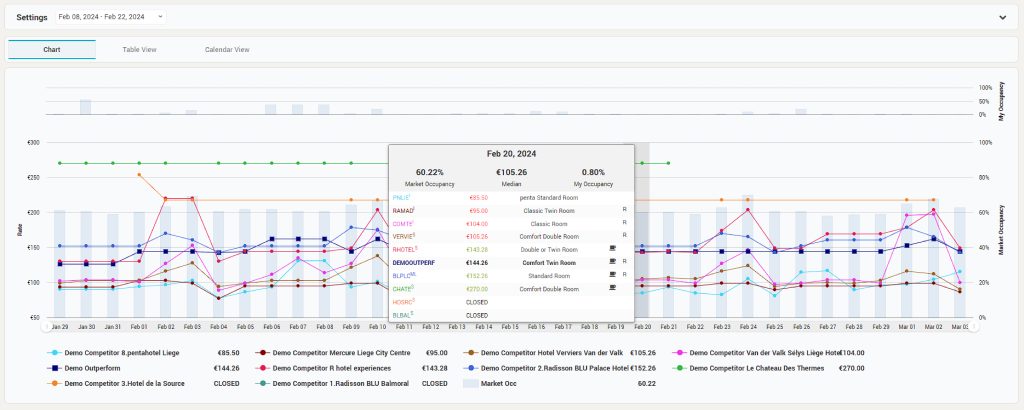
1. “Settings bar” with the date picker pinned to it. The date picker allows the user to chose predefined periods or custom periods. Once the Settings bar is clicked, filters which allow the user to generate a custom reports, with the desired parameters, are revealed. “Refresh page” generates the report with the customized filters.
2. Details revealed at mouseover the chart, on particular dates.
3. Competitors can be disabled so that the user can focus on certain competitors. When hovering over the graph, competitor’s rates are displayed in front of each competitor’s name.
Table View
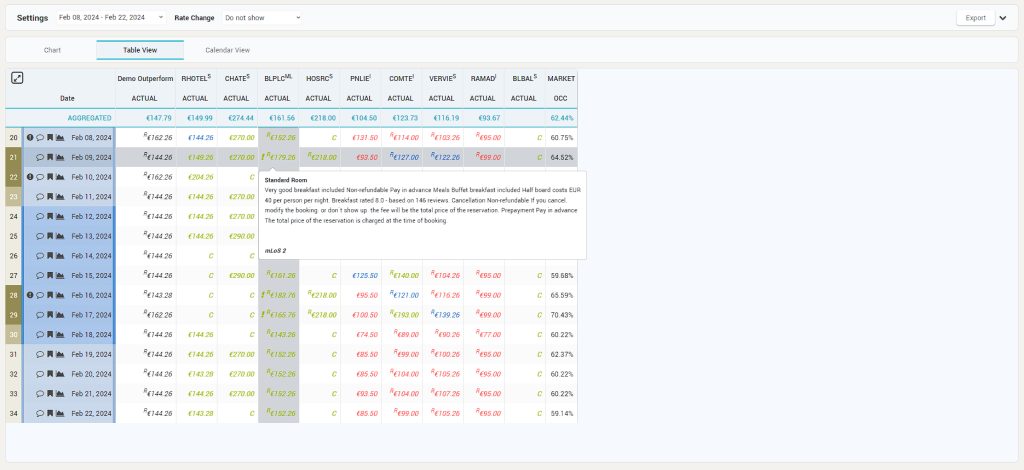
1. “Settings bar” with the date picker, “Rate Change” and “Export” options pinned to it. Once the Settings bar is clicked, filters which allow the user to generate a custom reports, with the desired parameters, are revealed. “Refresh page” generates the report with the customized filters.
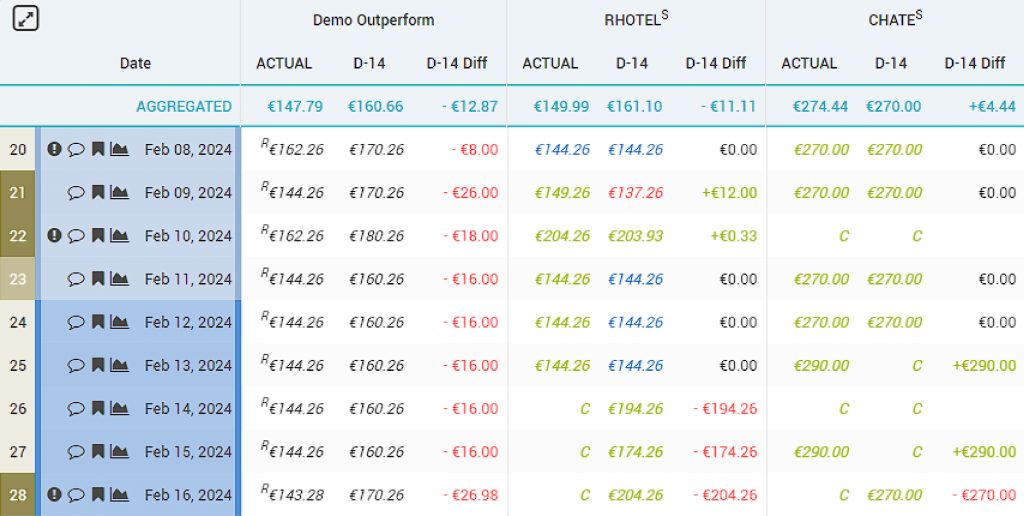
2. “Rate Change” with the options to show the rate changes over the days 1-7, 14 or 30.
3. Table with shopped data for the subscriber hotel and its competitors. The color coding applied is the one defined in the calendar tab. The restricted rates are marked with “R” and the MinLoS rates > 1 are marked with “!”. Hovering over a specific rate, details about the room-rate are displayed, including the MinLoS value.