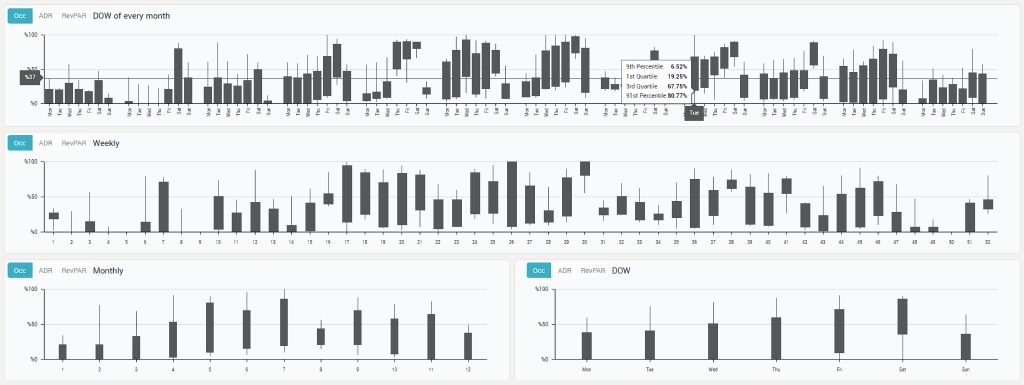
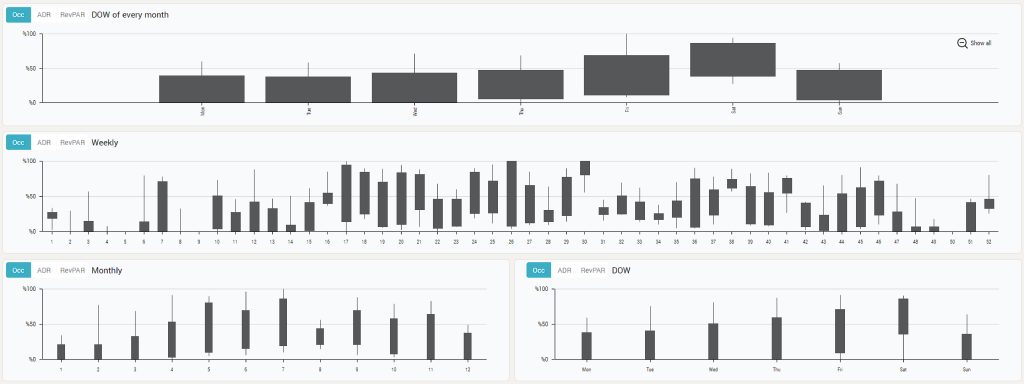
It allows the user to analyze OCC, ADR and RevPAR for the past 730 days, at different granularity:
- DoW of each month
- Weekly
- Monthly
- DOW

Dragging the mouse over a specific period, the graph will zoom in over that specific period. “Show all”, in the top-right corner will reveal the default period again. In the example below, the month of November has been zoomed in, inside the DOW of every month graph:

“DOW of each month” shows how the hotel performed on each DOW, on a monthly basis.
The Full Year Analysis report is based on Percentiles and Quartiles.
“A percentile is a measure at which that percentage of the total values are the same as or below that measure. For example, 90% of the data values lie below the 90th percentile, whereas 10% of the data values lie below the 10th percentile.
Quartiles are values that divide a (part of a) data table into four groups containing an approximately equal number of observations. The total of 100% is split into four equal parts: 25%, 50%, 75% and 100%.
The first quartile (or lower quartile), Q1, is defined as the value that has an f-value equal to 0.25. This is the same thing as the twenty-fifth percentile. The third quartile (or upper quartile), Q3, has an f-value equal to 0.75. The interquartile range, IQR, is defined as Q3-Q1″ (source).
You can read more about Percentile and Quartiles here.
In the Full Year Analysis report the 91st Percentile and the 9th Percentile are used and 1st Quartile and 3rd Quartile.
Looking at a particular month, we have the details displayed at mouse over:
