This menu offers an overview of all hotels on which a user has access.
The most important KPIs like RN, Revenue, ADR and RevPAR are displayed in table view, cards and graphs, according to the grouping and period selected. Budget and Forecast values are also analyzed.
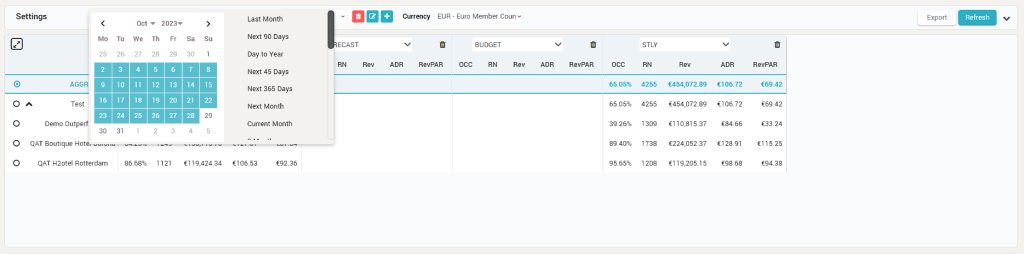
The date range selector
offers the possibility to either select specific periods or pre-defined periods: Yesterday, Today, Last Month, Current Month, Next Month, Next 3 Months, Next 12 Months, Current Year, Q1/2/3/4, S1, S2, Year to Date, Date to Year, Q1/2/3/4 Next Year, S1/S2 Next Year. Past Data can also be inspected.
Groupings
are created according to each user’s needs. Each created grouping can have multiple options (e.g.: grouping by cities with options for different cities). Existing Groupings can either be deleted or edited.
The grouping options can be reordered with drag and drop inside the Edit Group screen and the order will be reflected inside the grid.
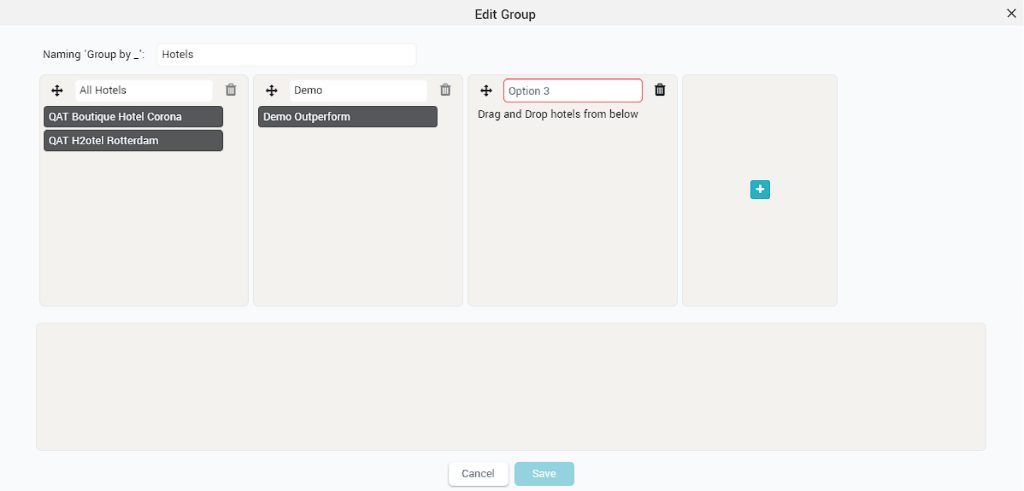
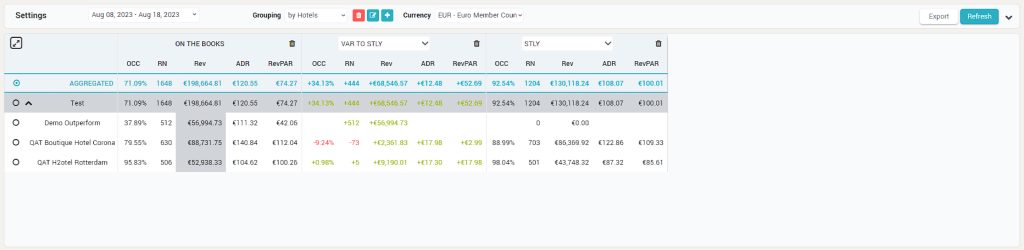
Table View
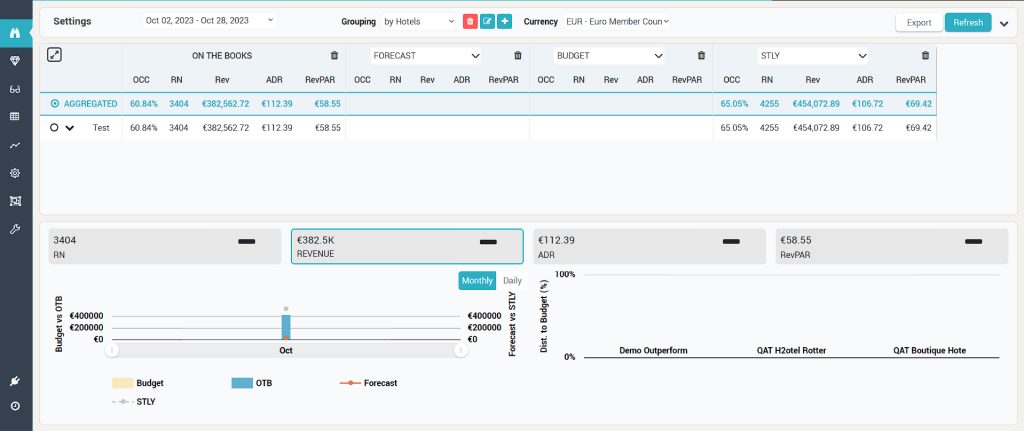
It displays values for the selected period and grouping, comparing OTB values with selected metrics: Budget, Distance to Budget, Forecast, Distance to Forecast, STLY, VAR to STLY, Actual LY, VAR to LY, Pickup 1 – 7, 14, 30. When any Pickup option is selected, RevPAR column changes into ADR Diff.
Values inside the Multi-Property grid can be viewed grouped or per each property, by using the expand arrow. When selecting a group or a hotel, the cards and the graph display the values for the group or hotel selected inside the table.
The table can be maximized for better view and can also be exported (all columns are included, not just the two selected) or added as an attachment in E-mail Templates.
OTB and Pickup Cards
With the values for the most important KPIs, displaying data for the selected period and grouping: RN, Revenue, ADR and RevPAR. When clicking on a card, the below graphs display data for the selected KPI. The Green arrows (increase) and Red arrows (decrease) depict the Pickup value corresponding to table selection within pickup column. If no pickup column is selected, the pickup values for the previous day are displayed.
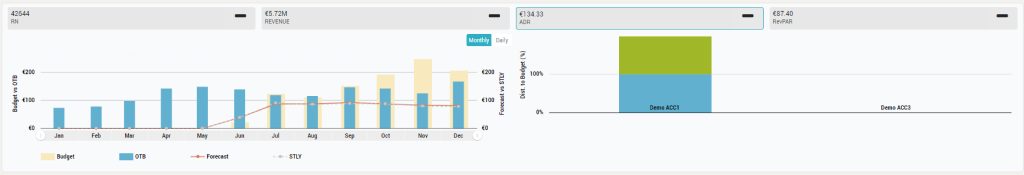
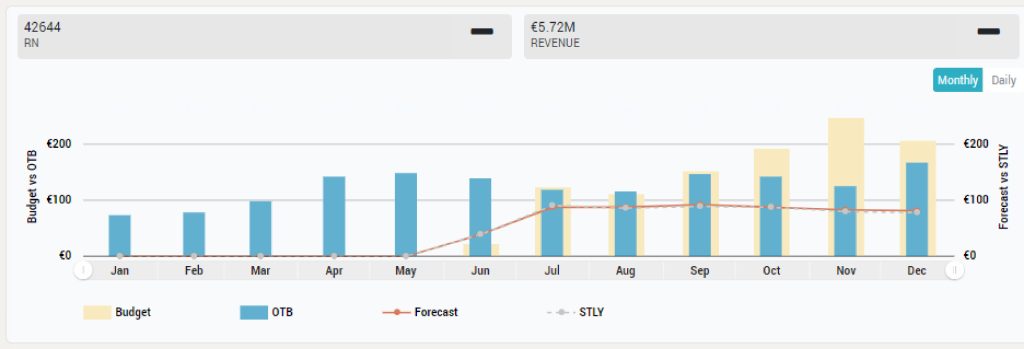
Budget vs. OTB and Forecast vs. STLY
Graph can display monthly or daily values for Budget vs. OTB in bars and Forecast vs. STLY in lines.
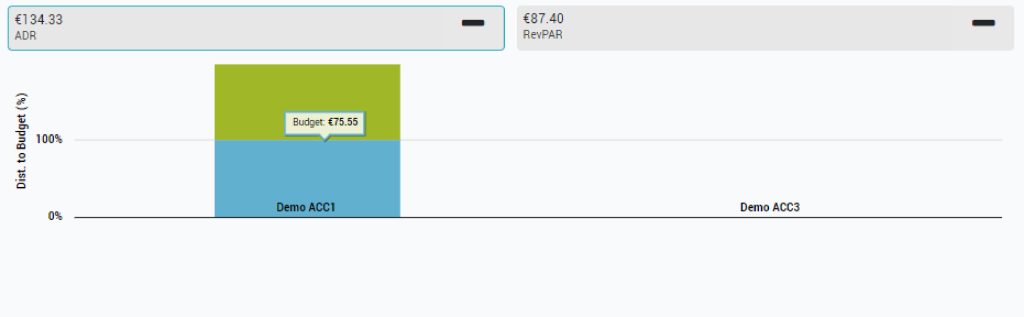
Distance to Budget Graph
Shows grouped values per hotel for Distance to Budget.