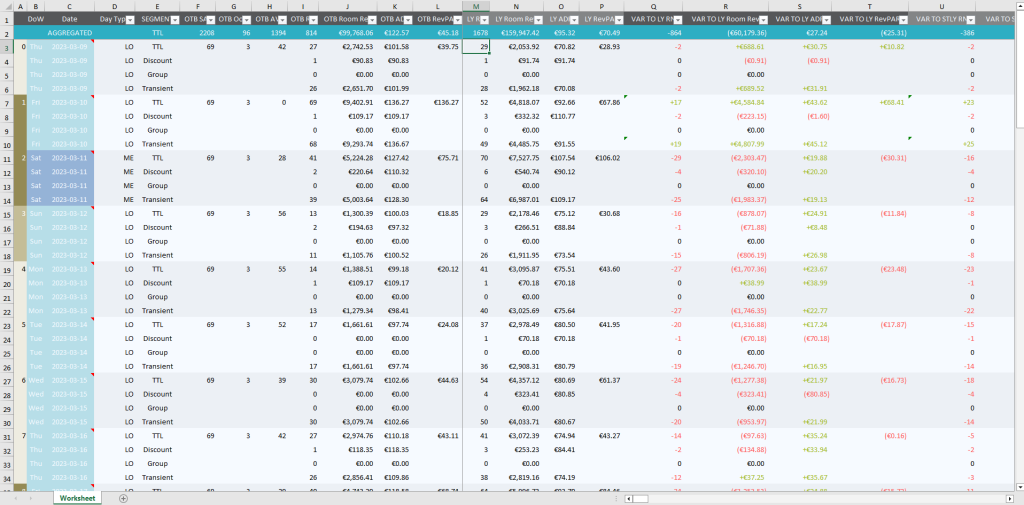
Report with data showing total values, per Market Segment / Channels / Room types, in different granularities (Daily / Weekly / Monthly). First line, under the headers, contains aggregated data. Each column has its own filter displayed when clicking on the header of the column.
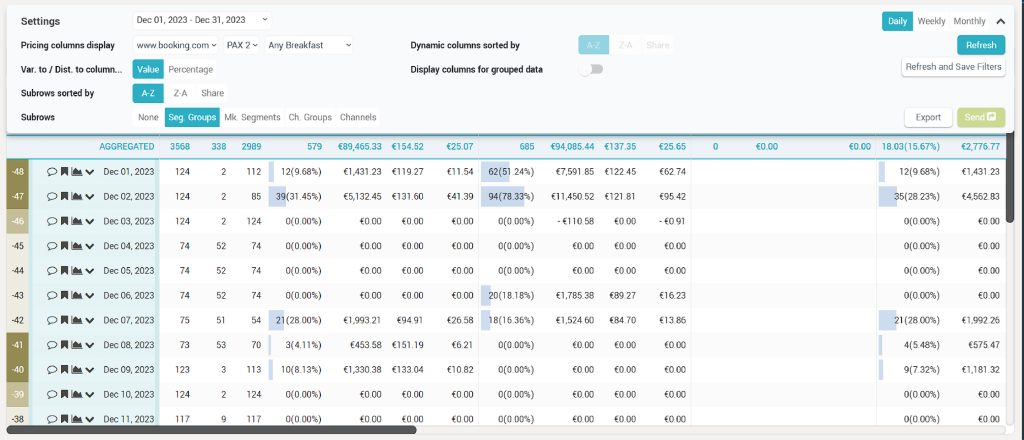
1. “Settings” Bar
Pinned to the “Settings” bar are the “Date Picker”, “Pickup” column options (Pickup -1 to – 7; -14 and -30) and the “Granularity”: Daily, Weekly, Monthly and FMonthly for the granularity per Fiscal Month (the fiscal months can be seen in Settings > Fiscal Year > Table on the right). Once the Settings bar is clicked, more filters are revealed. “Send” and “Export” buttons are also pinned to the “Settings” bar, so that they are visible even without clicking on the bar to reveal the rest of the filters.
2. Additional filters
The additional filters revealed after clicking on Settings bar are:
- “Pricing column display” – for selecting the channel (hotels using OTA insight have more options), number of PAX and if the rate includes Breakfast or not;
- “Var. to / Dist. to column display” – if these columns display data as % or values;
- “Subrows sorted by” – option to sort the subrows;
- “Subrows” – options of data displayed as subrows;
3. “Dynamic columns sorted by” filter
This filter is available for Market Segments tab, Channels tab and Room types tab. “Room type column sorted by” filter is available only for Room Types tab.
4. “Refresh” button
This button will display the table according to the active filters. “Refresh and Save filters” will display the table according to the active filters and will save them as default for the current user.
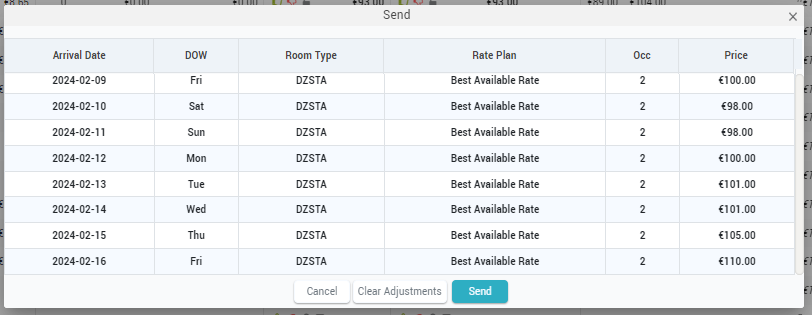
5. “Send” button
It becomes active after selecting days for update in “My Hotel > RECO” column. Once clicked a pop-up window will display the rates selected for the update in order for the user to double check before sending them. The window offers the possibility to clear the adjustments (deactivate selected dates for update), send the rates or cancel the operation:
6. “Export” button
It gives the possibility to export the Timeline with the selected filters. Only the active tab is exported.
7. There are 4 tabs available:
“Timeline” with total values, “Market Segments” with data per market segments, “Channels” for data per existing channels and “Room Types” for data per room type if provided by the PMS. Tabs order can be changed by using the arrows that appear at mouse over.
8. “Add” button
Allows the user to include or exclude columns from display. This functionality is applied per user (except Compset column which is applied per user and per hotel. If a competitor is changed, the filter is reset). The order of the columns can be changed by drag and drop.
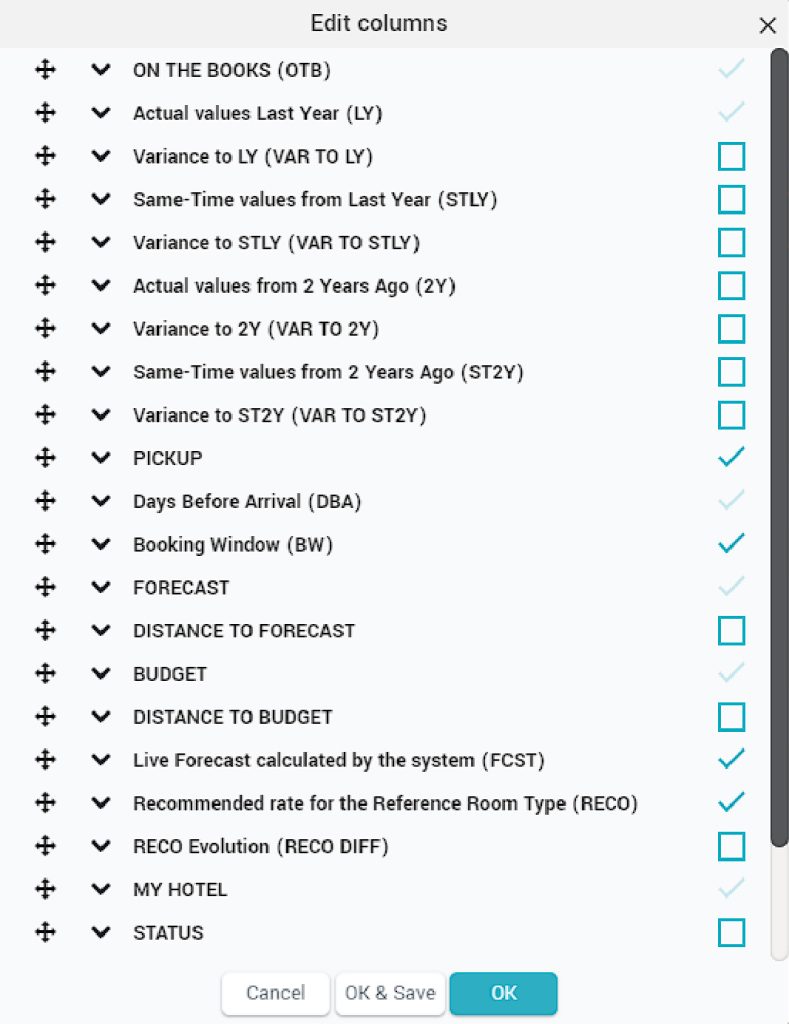
“OK” button will display the report with the defined columns in the current report use. “OK & SAVE” button will save and display the selected columns for future report use as well.
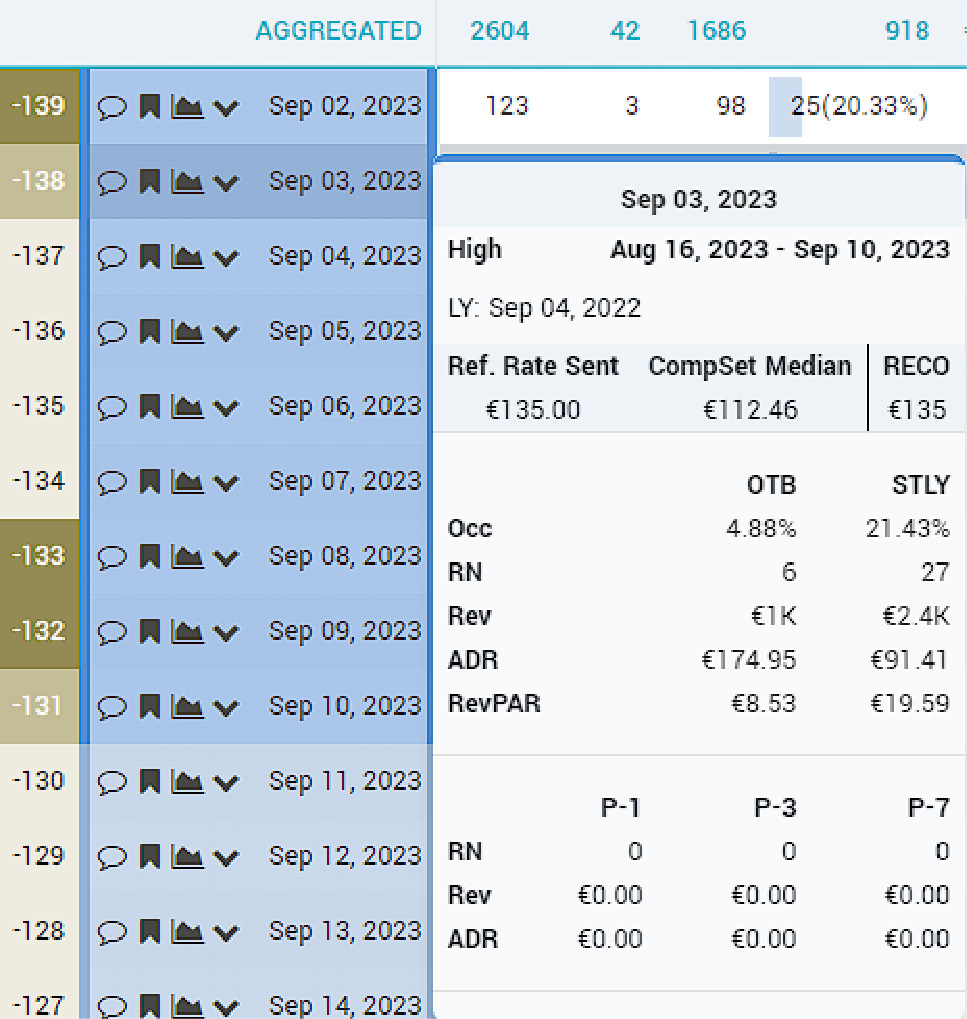
9. Date column
It holds not only the date, but also the alert symbol for high pickup, the “Add Comment” option, “Show Day Inspector” option and the show / hide sub-rows. The background color of the cell corresponds to the season or event type.
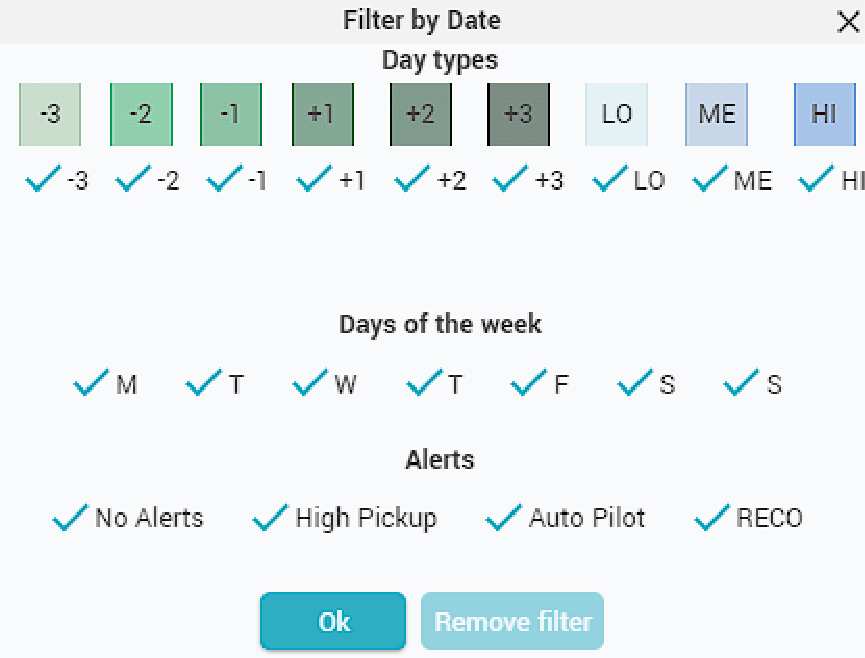
Date column also holds a filter by date and has the following options, displayed after clicking on the column header:
- Day Types (Seasons & Events)
- Days of the week
- Alerts: No Alerts, High Pickup, Auto Pilot and RECO
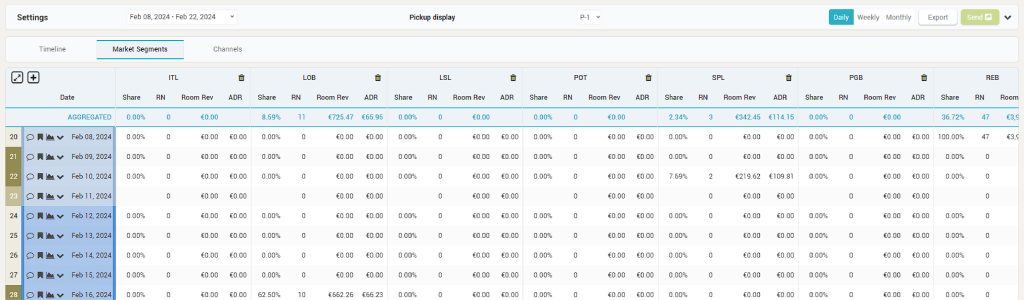
Market Segments / Channels / Room Types tab
All three tabs contain the same type of data: Share, RN, Room Revenue and ADR per Market Segment / Channels /Room Types.
Columns can be re-arranged by using the filter “Dynamic columns sorted by” (A-Z, Z-A or Share). Room Types tab has an additional filter: “Room Types column shared by: Total INV or Room Type INV”.
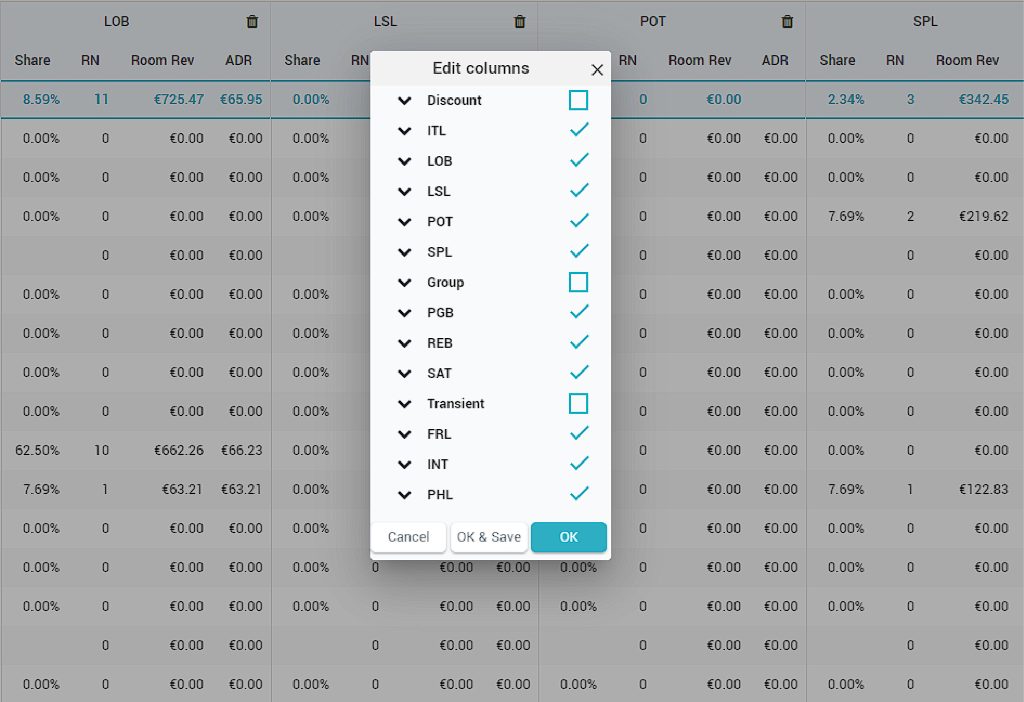
The “Edit columns” functionality allows the user to focus on certain Market Segments / Channels / Room Types.